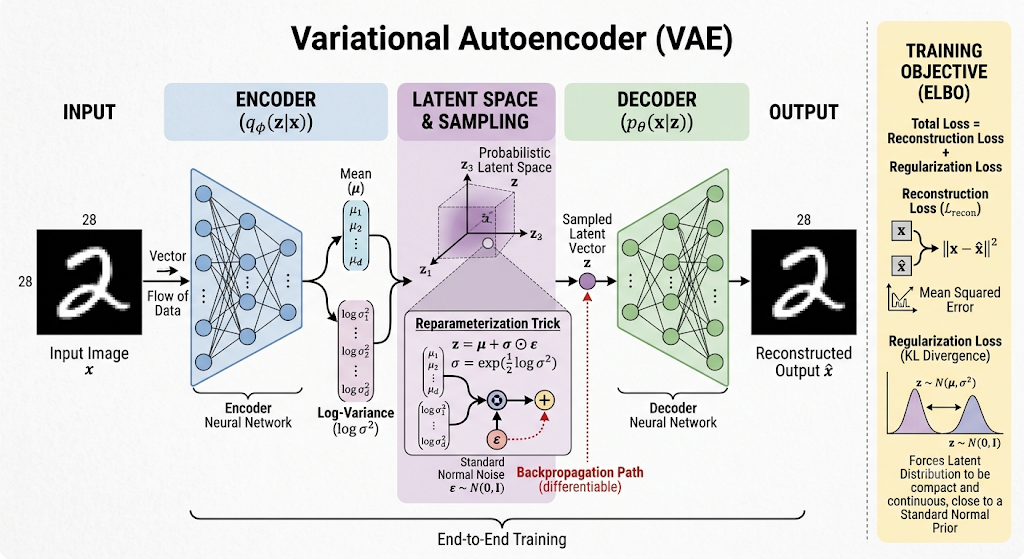
Schematic over Variational Autoencoder with its components, an encoder block followed by a decoder block.
Generating Synthetic District Heating Data with a Physics-Informed Variational Autoencoder (VAE)
Why synthetic district heating data?
Real operational data from district heating (DH) substations is scarce, fragmented across utilities, and often commercially or privacy restricted. Yet almost everything we want to build on top of DH networks such as heat load forecasters, model predictive controllers, anomaly detection benchmarks, network simulations, needs large volumes of realistic labelled and controllable data.
We built a generative model that learns the joint distribution of substation measurement signals and can then produce unlimited synthetic time series. Once trained, generation is essentially free: a single forward pass through a small decoder, no per-token inference bill, no API cost. Unlike prompting a large language model (LLM) to "make up" plausible numbers, the model has learned the actual statistical and physical structure of real substation data.
Training data
We trained on the PreDist dataset [1], an openly licensed (CC-BY-4.0) collection of service data from 93 district heating substations, published together with a labelled fault detection framework. The substations span two heat meter manufacturers and range from small residential units to large commercial ones, sampled at 10-minute resolution. Signals include supply and return temperatures, flow, and heat power on both the primary and secondary side of the substation.
Since our goal is to model normal operation, we extracted the fault-free segments of the dataset and built a preprocessing pipeline that windows, normalizes, and aligns the signals for training. We split the data into training, validation, and test sets by implementing a stratified shuffle-split strategy, where every split gets a proportional mix from each of the two manufacturers mentioned above..
Model: Conditional VAE
Our generator is a conditional Variational Autoencoder (CVAE). A plain autoencoder compresses inputs to a latent code and reconstructs them, but its latent space has "holes", decoding an arbitrary latent point generally produces unusable data. Our VAE-model instead makes the encoder output a distribution q(z|x) over latent codes, by implementing a Kullback-Leibler (KL) divergence term in the loss function, which moves the distribution toward a standard normal prior N(0, I). Because the latent space is regularized to match the prior, we can generate new data by simply sampling z ~ N(0, I) and passing it through the decoder.
The conditional part lets us steer generation, the decoder receives a conditioning input identifying the substation, so the same trained model produces synthetic data matching the characteristics of any substation in the training set, such as residential or commercial and manufacturer.
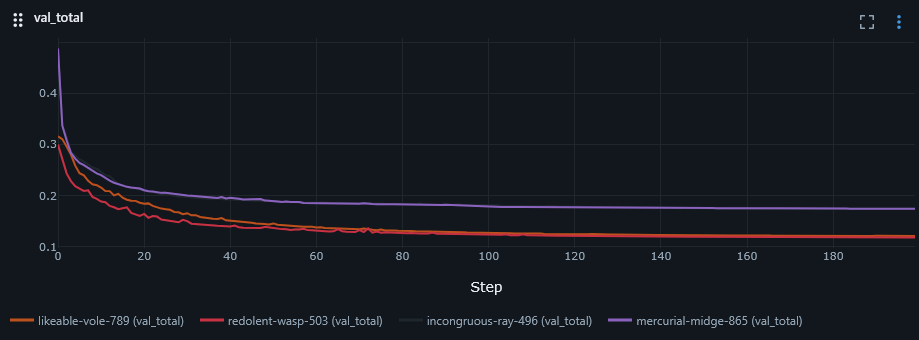
The model operates on full sequences rather than autoregressively so the decoder emits an entire multi-channel time series window in one pass, which keeps generation fast and avoids error accumulation over long horizons. Below we show the total validation loss which is the sum of the following terms: reconstruction loss, KL-loss and Physics informed loss. The loss-curve decreases for each training step, showing that the model learns the underlying distribution. The different colors show different experiments for different hyper parameter configurations.
A physics-informed loss
Purely statistical reconstruction losses treat each signal channel independently, nothing prevents the model from generating a supply temperature, a flow, and a heat power that are each individually plausible but jointly physically impossible. In a DH substation these signals are coupled by the energy balance:
where is heat power, the mass flow rate, and the specific heat of water. We add a physics-informed penalty on the violation of this balance, normalized by each substation's mean heat power so that the term is dimensionless and weighs a 30 kW residential substation and a 30 MW commercial one equally. The full training objective is:
The physics term also gives us something valuable for free: a reference-free quality metric . For any generated sample, we can measure how well the energy balance holds, no held-out dataset is required.
Results
Reconstruction
Training converged stably, with validation loss decreasing throughout 200 epochs, no early stopping was applied. We compared hyperparameter configurations and selected the model with the lowest validation loss. The figures below compare reconstructed signals against the held-out test set for two substations:
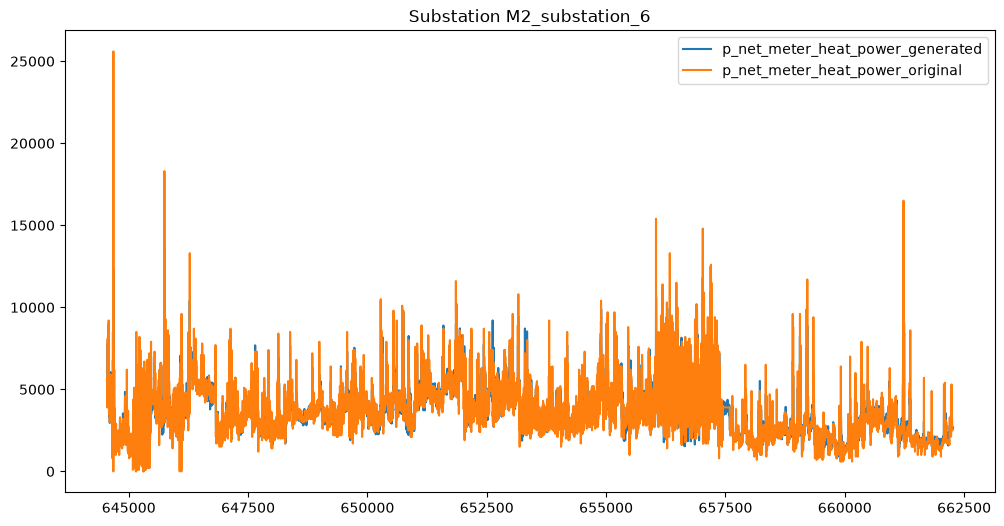
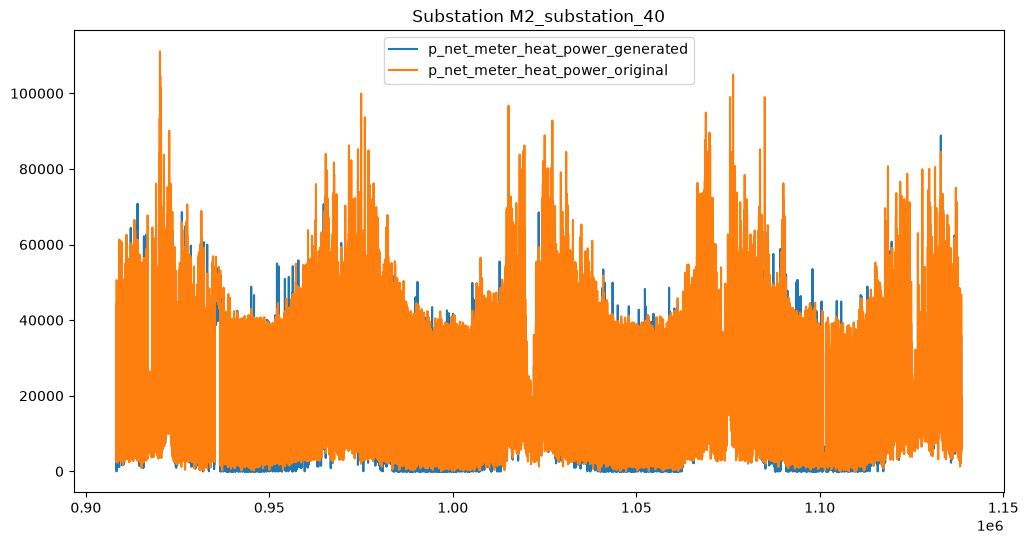
We observed a spread in the MAPE metric, which is inflated for small substations because heat power frequently approaches zero (summer nights, no-draw periods), where relative errors blow up even for small absolute deviations. R² above 0.8 in both cases indicates the model captures the underlying signal structure well. Performance is strongest for large substations with smooth aggregate load, and noisier for small buildings dominated by stochastic domestic hot water draws.
Generation
Using the trained model, we generate synthetic power, there is no paired ground truth to compare against sample by sample, in the following two plots we can see time series data generated by the model. As can be observed, the data shows the characteristic power consumption pattern, with both daily as well as monthly usage patterns.
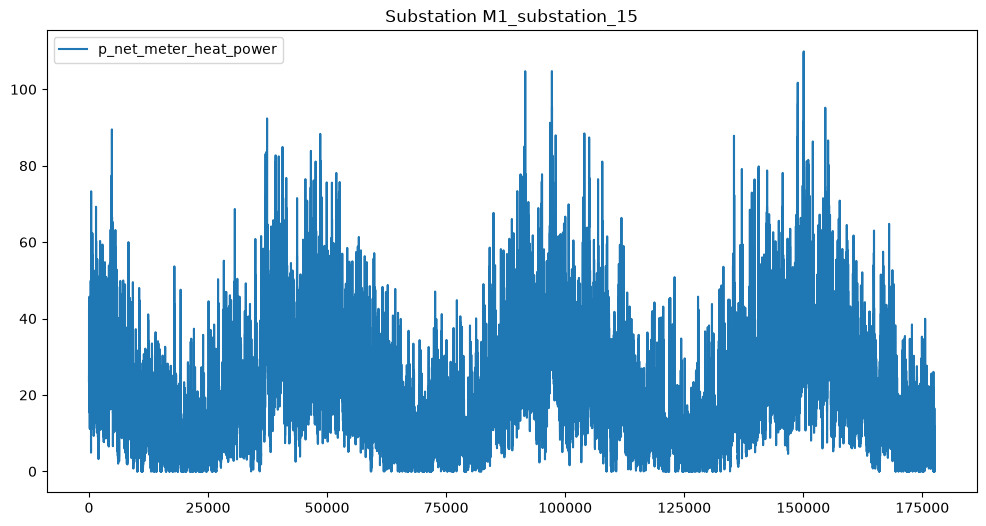
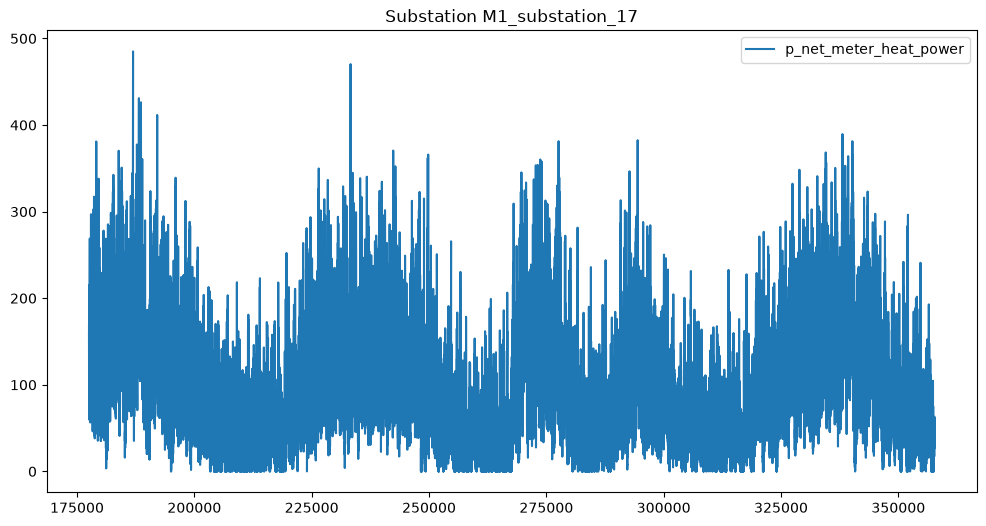
The synthetic data covers all signal types needed for DH network analysis, primary and secondary supply/return temperatures, flows, and heat power which can be fed to downstream tasks directly. For example, we can use the synthetic data for training predictive models, formulating and testing optimization problems, and driving simulations in District Heating network software.
Limitations and next steps
The model is trained on a single network's 93 substations across two manufacturers, generalization to other networks and meter types is untested. The physics constraint currently covers the primary-side energy balance only. The secondary side obeys the same relation, and the two are coupled through the heat exchanger, which is a natural extension. Finally, the strongest validation of synthetic data is downstream utility: a train-on-synthetic, test-on-real (TSTR) forecasting experiment is our next step.
Reference
[1] Roelofs, C. M. A., Guevara Bastidas, E., Hugo, T., Faulstich, S., & Cadenbach, A. (2026). Enabling predictive maintenance in district heating substations: A labelled dataset and fault detection evaluation framework based on service data. Energy , 355, 141178. https://doi.org/10.1016/j.energy.2026.141178
